Ceilemeter 的 sample 和 event
Ceilemeter 为 OpenStack 提供了监控和告警服务,从 Havana 版本起成为正式项目。Ceilometer 收集的数据类型有两种,sample 和 event。本文主要以版本 Icehouse 为例,分析这两类数据的差异和作用。
- Sample: 资源的使用量,比如虚拟机 CPU 的使用率、网卡速率等,它们由 ceilometer-central-agent 和 ceilometer-compute-agent 采集。
- Event: 资源的状态变更信息,比如虚拟机创建、关机等信息,它们由 ceilometer-notification-agent 采集。
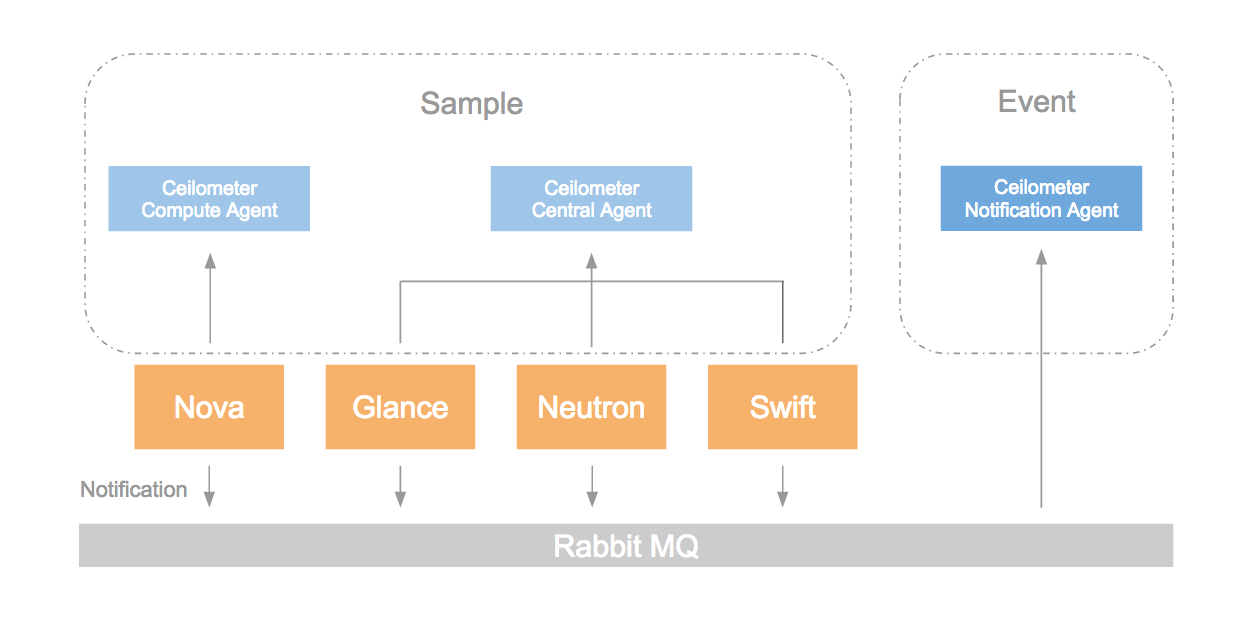
Sample
顾名思义,sample 的中文译为样品,它是资源使用量的采样值,ceilometer-compute-agent 负责采样虚拟机 CPU、内存 等的使用量,ceilometer-central-agent 负责采样 glance、neutron 和 swift 等云资源的使用量,采样的周期可在配置文件中设置,通常为 5 min。Sample 记录了以下资源的使用量:
- Nova: instance, memory.usage, cpu, cpu_util, disk.read.requests, disk.read.requests.rate, disk.write.requests, disk.write.requests.rate, disk.read.bytes, disk.read.bytes.rate, disk.write.bytes, disk.write.bytes.rate, network.incoming.bytes, network.incoming.bytes.rate, network.outgoing.bytes, network.outgoing.bytes.rate, network.incoming.packets, network.incoming.packets.rate, network.outgoing.packets, network.outgoing.packets.rate。
- Glance: image, image.size。
- Neutron: ip.floating。
- Switf: storage.objects, storage.objects.size, storage.objects.containers。
下列是虚拟机 cpu 的使用量的一个 sample。
{
    "counter_name": "cpu",
    "user_id": "b2ae8b4b230c4038be34a76dd1cb306c",
    "resource_id": "2fada6ce-11f1-4c2e-8fa6-ae2e4d630226",
    "timestamp": "2015-08-26T09:00:27",
    "recorded_at": "2015-08-26T09:00:27.898000",
    "message_id": "e55f3cd0-4bd0-11e5-8722-6cae8b6692d8",
    "source": "openstack",
    "counter_unit": "ns",
    "counter_volume": 17573760000000,
    "project_id": "f11d38152cb140d0a0697b16da4aad8f",
    "resource_metadata": {
        "ephemeral_gb": "0",
        "flavor.vcpus": "4",
        "OS-EXT-AZ.availability_zone": "nova",
        "display_name": "test_vm",
        "flavor.ram": "8192",
        "ramdisk_id": "None",
        "flavor.name": "4C-8G",
        "disk_gb": "20",
        "kernel_id": "None",
        "image.id": "37591182-e9ac-47bd-9d5e-052ba124e231",
        "flavor.id": "7",
        "host": "39781e124dd1f572b5df1a667856edb5afda4de3871c771b375daf96",
        "flavor.ephemeral": "0",
        "image.name": "CentOS-5.5 v5-64bit",
        "image_ref_url": "http://10.10.180.209:8774/156b867ed386468daee72bf5e4bb7437/images/37591182-e9ac-47bd-9d5e-052ba124e231",
        "name": "instance-0000009d",
        "cpu_number": "4",
        "flavor.disk": "20",
        "root_gb": "20",
        "image.links": "[\"{u'href': u'http://10.10.180.209:8774/156b867ed386468daee72bf5e4bb7437/images/37591182-e9ac-47bd-9d5e-052ba124e231', u'rel': u'bookmark'}\"]",
        "memory_mb": "8192",
        "instance_type": "7",
        "vcpus": "4",
        "image_ref": "37591182-e9ac-47bd-9d5e-052ba124e231",
        "flavor.links": "[\"{u'href': u'http://10.10.180.209:8774/156b867ed386468daee72bf5e4bb7437/flavors/7', u'rel': u'bookmark'}\"]"
    },
    "counter_type": "cumulative"
}
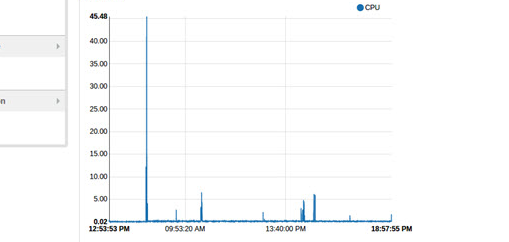
总体来说,sample 是云资源使用量的采样值,即资源使用量随时间的变化,侧重量的是变化。下图是根据多个 sample 生成的 cpu 使用量图表。
Event
每当 OpenStack 的资源状态发生变化时,比如创建虚拟机、关闭虚拟机、调整卷大小等等,相应的服务都会发送 notification 至消息队列。Ceilometer-notification-agent 从消息队列取出这些 notification,经处理后转换为 event。Event 记录了以下类型的数据:
- Nova: scheduler.run_instance.scheduled, scheduler.select_destinations, compute.instance.*。
- Glance: image.update, image.upload, image.delete, image.send。
- Neutron: floatingip.create.end, floatingip.update.*, floatingip.exists, network.create.end, network.update.*, network.exists, port.create.end, port.update.*, port.exists, router.create.end, router.update.*, router.exists, subnet.create.end, subnet.update.*, subnet.exists, l3.meter。
- Switf: storage.objects.incoming.bytes, storage.objects.outgoing.bytes, storage.api.request。
- Cinder: volume.exists, volume.create.*, volume.delete.*, volume.update.*, volume.resize.*, volume.attach.*, volume.detach.*, snapshot.exists, snapshot.create.*, snapshot.delete.*, snapshot.update.*, volume.backup.create.*, volume.backup.delete.*, volume.backup.restore.*。
下图为一个创建虚拟机的 event:
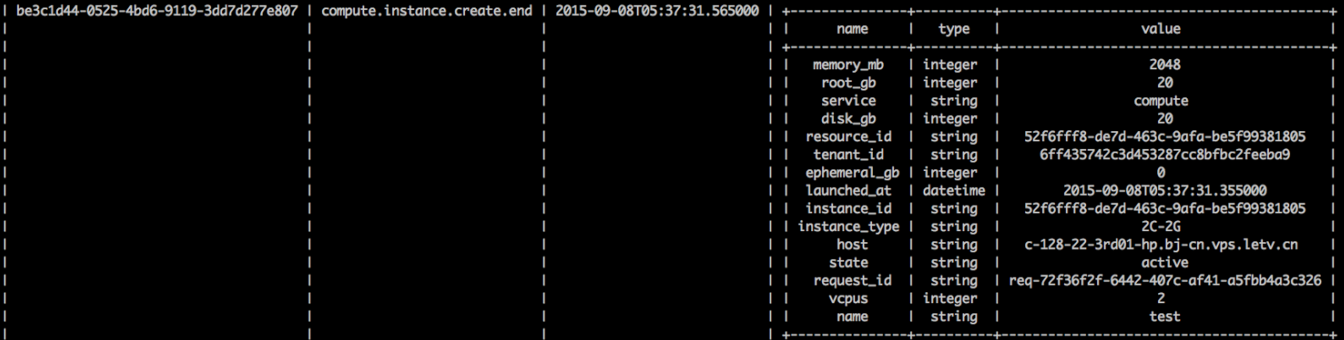
由上可知,event 描述的是资源状态的变化,比如创建、更新、删除等,只有在资源状态有变化时,event 事件才会发出(*.exits 类型的事件除外),和 sample 相比,它侧重质的变化。